How to Read Buy and Sell Signals on TradingView Like a Pro
18 Sep, 2026
6 Views 0 Like(s)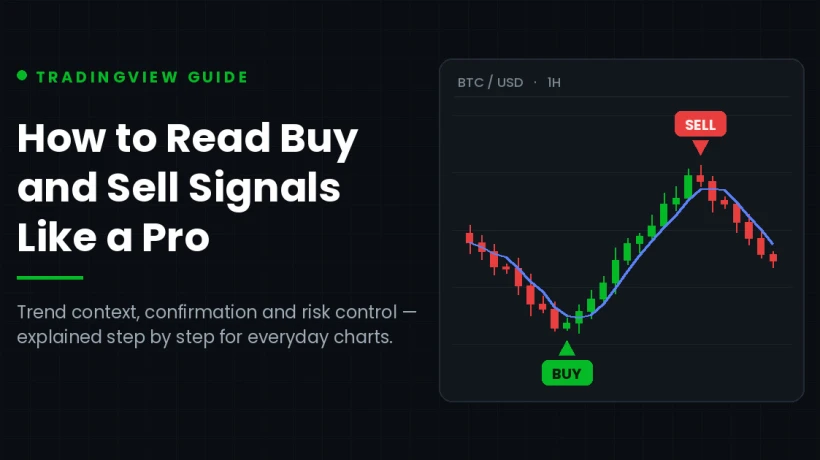
Learn how to read buy and sell signals on TradingView like a pro. Check the trend, wait for the candle close, confirm the volume and set your risk first.
Most new traders open a chart, add an arrow-based tool, and expect easy money. Then reality arrives. The chart prints an arrow, price moves the other way, and confidence disappears fast.
After two decades of watching charts and coaching traders, I can tell you the problem is rarely the tool. The problem is the reading. Buy and sell signals are clues, not commands. Pros treat them that way, and their results reflect it.
This guide breaks down how experienced traders read buy and sell signals on TradingView. You will learn what these markers really mean, how to filter them, and how to avoid the traps that drain small accounts. Every point below comes from screen time, not theory.
What Buy and Sell Signals Actually Mean
A signal is simply a visual alert. When conditions inside a script are met, the chart prints an arrow, a label, or a colour change. Nothing more happens automatically.
Therefore, the arrow is a statement about the past, not a promise about the future. It says that a certain pattern just completed. Whether price follows through depends on trend, volume, news, and liquidity.
Professionals understand this difference. As a result, they never ask "should I buy because of the arrow?" Instead, they ask "does the rest of the chart agree with this arrow?" That single shift changes everything.
Buy and sell signals also come in two broad families. Some react to price crossing a level, such as a moving average. Others react to momentum shifts, volatility jumps, or pattern completions. Knowing which family your tool belongs to helps you predict when it will struggle.
Why Beginners Misread Buy and Sell Signals
Beginners usually make three mistakes. First, they take every marker on the screen. Second, they ignore the wider trend. Third, they enter without a stop.
Also, many traders stack five tools on one chart and hope for agreement. Unfortunately, more lines rarely mean more clarity. Often they create confusion and hesitation at the exact moment a decision is needed.
A better approach exists. Read buy and sell signals inside a framework. The five steps below form that framework.
Step 1: Start With the Higher Timeframe Trend
Before you judge any arrow, zoom out. Check the daily chart if you trade the one-hour chart. Check the four-hour chart if you scalp the five-minute chart.
Next, ask a simple question. Is price making higher highs and higher lows, or the opposite? In an uptrend, buy markers carry more weight. In a downtrend, sell markers do.
For example, a buy arrow printing during a strong daily downtrend usually marks a bounce, not a reversal. Pros either skip it or take a much smaller position. Meanwhile, a buy arrow inside a healthy uptrend deserves real attention.
This one filter removes a large share of losing trades. Moreover, it costs you nothing but ten seconds.
Step 2: Wait for the Candle to Close
Live candles change. A green arrow can appear at minute three and vanish by minute sixty. Traders who chase these flashes end up frustrated.
Consequently, patient traders wait for the bar to close before acting. A closed candle is final. The signal on it is final too.
Yes, you will sometimes enter a little later. Still, you will avoid a long list of fake entries. Over a month, that trade-off usually favours patience.
For this reason, many experienced traders set their charts to a slightly higher timeframe. Fewer candles mean fewer markers. Fewer markers mean better focus.
Step 3: Confirm With Volume and Momentum
A signal without participation is weak. Volume shows whether real buyers or sellers stand behind the move.
So, look at the volume bars under the price chart. Rising volume on the signal candle supports the move. Thin volume suggests a quiet market that may drift sideways instead.
In addition, a momentum tool helps. RSI, MACD, or a simple moving average can confirm direction. When your trading indicator and the price action agree, the setup becomes far more attractive. Buy and sell signals that arrive with that agreement tend to follow through more often.
However, keep it light. Two confirmations are plenty. Beyond that, you will start missing good entries while you wait for perfect agreement that never comes.
Step 4: Read the Levels Around the Signal
Location matters as much as the arrow itself. A buy marker at the top of a long rally is risky. The same marker at a tested support level is far more interesting.
Therefore, mark your key levels before the session starts. Draw support, resistance, and any obvious range boundary. Then wait.
When buy and sell signals appear near these levels, they gain context. A sell arrow into major resistance tells a clean story. A sell arrow in the middle of empty space tells you very little.
Step 5: Set Your Stop and Target First
This step separates hobby traders from professionals. Before entry, you must know two prices: where you are wrong, and where you will take profit.
Place your stop beyond a structural point, such as the recent swing low. Then measure your target. Many traders look for at least twice the risk they take.
Because of that rule, you can be right less than half the time and still grow your account. In short, risk control does more for your results than any arrow ever will. Position size follows the same logic. Risk a fixed small percentage of your account on each trade, and no single loss can hurt you badly.
How to Test a Trading Indicator Before You Trust It
Never trade a new tool with real money on day one. Test it first.
Start with TradingView's bar replay feature. Move backwards, then step forward candle by candle. Record what happens after each marker. Fifty examples give you a rough feel. Two hundred give you real data.
After that, run a forward test on a demo account for a few weeks. Track win rate, average win, average loss, and the worst losing streak.
Furthermore, test across different conditions. A trading indicator that shines in trending markets often struggles in choppy ones. Knowing that weakness in advance protects you later. Test across several markets too, because buy and sell signals rarely behave the same way on forex, crypto, and equities.
Watch Out for Repainting
Repainting is the biggest trap in this space. A repainting script changes its history. Losing markers quietly disappear, so the past looks perfect while the present disappoints.
To check for this, compare the live chart with bar replay. Then reload the page and look again. If arrows move or vanish, the tool repaints.
Honest scripts lock their markers once a candle closes. Consequently, what you see in history is what you would have seen live.
Where AI-Powered Trading Signals Fit In
The signal landscape has changed. Classic scripts use fixed rules, such as a moving average crossover. AI-powered trading signals work differently. They study large amounts of price data and adapt to changing conditions.
Because of this flexibility, AI trading signals can adjust when volatility expands or contracts. A rule that suited a calm market may be loosened when ranges widen. In theory, that helps the tool stay relevant longer.
Still, the same rules apply. AI trading signals are not predictions. They are probability estimates dressed in clean visuals. Therefore, trend context, confirmation, and risk control remain essential. Treat AI trading signals exactly like any other input on the chart.
Also, remember that AI-powered trading signals learn from history. When market behaviour shifts sharply, performance can dip until conditions settle. Reviewing recent results every month keeps your expectations realistic.
A good Algo Indicator should also be transparent. Look for clear entry logic, published statistics, and honest drawdown numbers. If a seller promises certainty, walk away. No Algo Indicator on earth wins every trade.
Judge any Algo Indicator on three points: rule clarity, tested results, and behaviour during losing streaks. Those three answers tell you more than a screenshot of winners ever could.
Build Your Own Signal Checklist
Pros repeat the same process daily. You should too. Run through these questions before every entry:
- Does the higher timeframe trend support this direction?
- Has the signal candle closed?
- Does volume confirm the move?
- Is price near a meaningful level?
- Do I know my stop and target?
- Is my position size correct for this stop?
If you answer no to any question, skip the trade. Another setup always arrives.
Use Alerts Instead of Watching Charts
Screen fatigue causes bad decisions. Alerts solve that problem.
TradingView lets you attach an alert to almost any condition. You can trigger one when a script prints an arrow, when price crosses a level, or when volume spikes. Set the alert once, then step away.
When the alert fires, you arrive with a clear mind. Next, you run your checklist calmly instead of reacting to a flashing candle. Consequently, your entries improve without any change to the tool itself.
Keep your alert list short as well. Five well-chosen alerts beat fifty noisy ones.
Common Mistakes That Ruin Good Signals
Even solid buy and sell signals fail when traders handle them poorly. These habits cause the most damage:
- Revenge trading. One loss triggers three rushed entries.
- Moving stops. The stop slides further away as price approaches it.
- Overloading charts. Six tools create noise, not confidence.
- Ignoring news. Major releases override technical setups.
- Position sizing by feeling. Confidence is not a risk model.
Fix these habits first. Only then will better tools show their value.
A Simple Daily Routine
Structure beats motivation. Here is a routine that works for busy traders:
- Review the higher timeframe trend for each market you follow.
- Mark support and resistance on the chart.
- Set alerts instead of staring at screens.
- When an alert fires, run your checklist.
- Log the trade, including the reason for entry.
- Review your log weekly and look for patterns.
Within a few months, that log becomes your most valuable asset. It shows which setups suit you and which ones you should avoid.
Manage Expectations
No system wins every trade. Strong strategies often win between forty and sixty percent of the time. Profit comes from the size of wins compared with losses.
So, judge your performance across one hundred trades, not five. Small samples mislead everyone. Patience with data is just as important as patience with entries.
Also, accept quiet periods. Markets range for weeks at a time. During those stretches, most buy and sell signals underperform. Reducing size or standing aside is a professional decision, not a weakness.
Finally, separate the tool from the trader. When results slip, review your own execution first. In most cases, the buy and sell signals were fine and the discipline was not.
Putting It All Together
Reading buy and sell signals well comes down to habits, not secrets. Check the trend. Wait for the close. Confirm with volume. Respect levels. Define risk before entry.
Follow that sequence and the arrows on your chart stop feeling random. They become one input inside a complete plan. Meanwhile, your decisions become calmer and far more consistent.
At GainzAlgo, we believe traders deserve tools that support this kind of disciplined process rather than replace it. Clear rules, honest testing, and steady risk management will always matter more than any single arrow on a chart. Keep learning, keep your records, and let the process do the heavy lifting.



Comments
Login to Comment